8 min read
Do TikTok hooks predict views? An AI model scored 3,000 posts
What makes a TikTok get more views than a creator's other posts? An open AI model watched 2,881 public TikToks from 119 creators and scored the hook, speech, music and more. A strong hook helped a little. Looking like an ad hurt the most.
- research
- coeus
- video-jev
- tiktok

Entry · do-tiktok-hooks-predict-views
Everyone who posts on TikTok is told the same thing: the hook decides everything. We wanted to see how much that holds up when you measure it.
We took 2,881 public TikTok posts from 119 English-speaking creators and had an open AI model watch every one, with the sound on. It scored each post's hook, and answered seven other questions: is it an ad, is there speech, is there music, is there text on screen, is there a face in the first 3 seconds, and does it look AI-generated. Then we checked which answers went with more views.
The model is Coeus, our open Video Jev model, fine-tuned from Qwen3-Omni with the answer head from Cloudflare's Clef. It reads the frames and the soundtrack together, and gives a probability for every answer. None of these questions were in its training for the first test.
Full breakdown of results: Coeus, its weights and its benchmark results are on the model card on Hugging Face. The code is on GitHub.
At a glance
| Signal | Link to views, within creator (Spearman) | p | Verdict |
|---|---|---|---|
| Looks like an ad | -0.10 | 0.001 | Fewer views |
| Music | -0.08 | 0.001 | Fewer views |
| Speech | +0.07 | 0.01 | More views |
| Hook strength | +0.04 | 0.03 | Slightly more views |
| Face in first 3 s | +0.04 | 0.15 | No clear link |
| On-screen text | -0.03 | 0.22 | No clear link |
| Looks AI-generated | +0.02 | 0.24 | No clear link |
| Duration | +0.02 | 0.28 | No clear link |
A p of 0.001 is the smallest that our 1,000 shuffles can give. All of these links are small. A Spearman correlation of 0.10 means the signal moves views a little, on average, over many posts. It does not tell you much about any one post.
How we measured it
- Posts: a random sample of 25 posts each from 120 English-speaking creators with at least 25 video posts. 3,000 posts in all, and 2,881 could be decoded and scored.
- Age: every post was 7 to 60 days old when we collected it in late September 2026, so its views had mostly settled. On our own films, views settle within hours.
- Target: each post's views percentile within its own creator. A post at 0.8 beat 80% of that creator's other posts. This takes out creator size, so a big account and a small one count the same.
- Input: the first 60 seconds of each video at 2 frames per second, with audio, in one pass.
- Test: Spearman correlation between each answer and the views percentile, inside each creator, then averaged.
- p-values: we shuffled the views within each creator 1,000 times and counted how often chance did as well.
- Speed: 1.19 seconds a post on one H200 GPU. The whole run cost about $4.50.
Comparing a post only with the same creator's other posts matters. Across creators, the result is mostly about who made the video. Inside one creator's feed, the topic, the face and the audience stay about the same, so what is left is closer to the video itself.
Looking like an ad costs the most
The strongest link was negative. Posts that Coeus thought looked like an ad got fewer views than the same creator's other posts.
Music went the same way, and speech went the other way. Posts where someone talks did a little better. Posts carried by music did a little worse.
Fewer viewsMore viewsNot significant
- Looks like an ad
- -0.10
- Music
- -0.08
- Speech
- +0.07
- Hook strength
- +0.04
- Face in first 3 s
- +0.04
- On-screen text
- -0.03
- Looks AI-generated
- +0.02
- Duration
- +0.02
Size of the within-creator Spearman correlation on 2,881 posts from 119 creators. The label shows the sign: minus means fewer views.
A face in the first 3 seconds made no difference here. Posts that opened on a face sat at the 49.9th percentile of their creator's views, and posts that did not sat at the 49.8th. In our study of 777 Meta video ads, opening without a face was the one signal that held within a brand. On organic TikTok it shows nothing.
Hook strength helps, a little
Coeus scored each post's hook strength without ever being trained on hooks. Within each creator, the posts with the top quarter of hook scores sat at the 50.4th percentile of that creator's views. The bottom quarter sat at the 47.1th. That is a gap of about 3 percentile points, with p 0.03.
The format and the type of hook barely moved views:
| Format | Share of posts | Mean views percentile |
|---|---|---|
| UGC | 74% | 49.9 |
| Skit | 19% | 51.9 |
| Demo | 3% | 52.1 |
| Text | 2% | 44.5 |
| Cinematic | 2% | 34.6 |
The one outlier is cinematic posts, 52 of them, at the 34.6th percentile. Animation was lower again, but there were only 9 animated posts.
Hook strength mattered more in some niches than others, from a correlation of 0.23 in food (146 posts) to -0.06 in tech (173 posts). Single niches are too small to trust, so we do not read anything into that spread yet.
Training on views helps a little more
The first test asked questions Coeus was never trained on. So we trained it on views.
- Data: posts split by creator, so the test creators were never seen in training. 11,085 posts from 325 creators to train, 1,018 from 30 creators to check, 3,169 from 60 creators to test.
- Question: "Compared with the same creator's other recent posts, how many views will it get?", with 10 levels.
- Input: the caption, the duration, and up to 60 seconds of video at 2 frames per second, with audio.
- Training: 7.7 hours on one H200. The test was scored once.
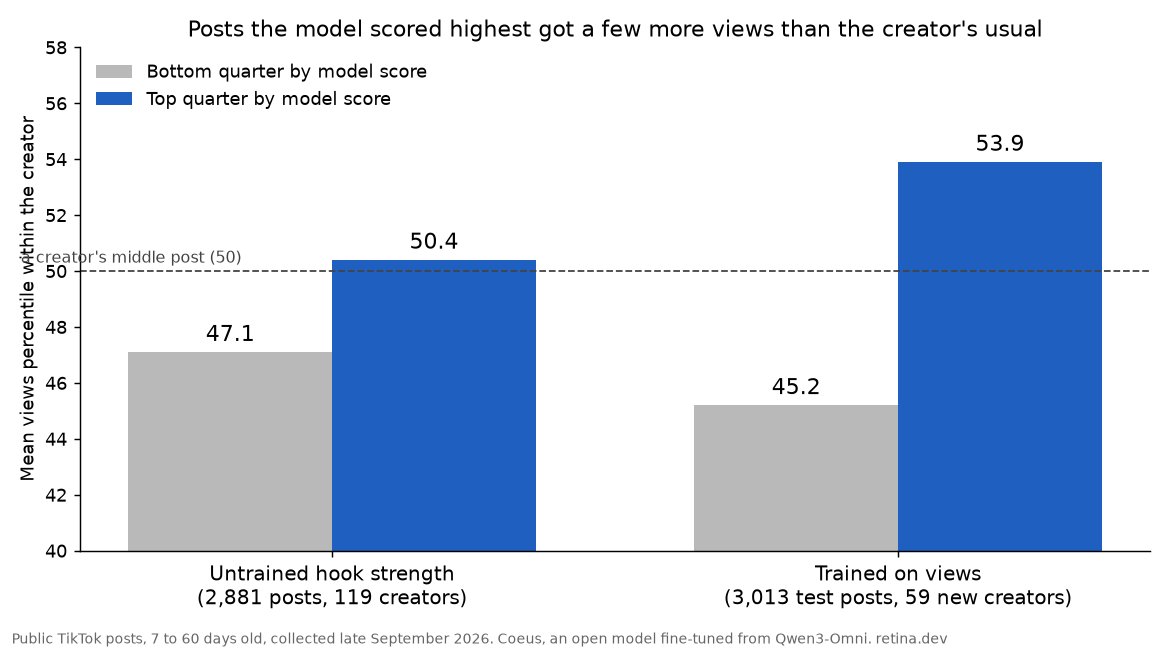
| Model | Posts | Spearman | Top vs bottom quarter |
|---|---|---|---|
| Trained on views, all test posts | 3,013 | 0.11 | 53.9 vs 45.2 |
| Trained on views, posts both models scored | 1,431 | 0.13 | 54.6 vs 45.5 |
| Untrained hook strength, same posts | 1,431 | 0.08 | 51.6 vs 45.3 |
On the same 1,431 posts, the trained model beat the untrained hook score by 0.046. The 95% interval runs from -0.03 to +0.12, and it was better in 88% of 2,000 resamples over creators. So it is likely better, but not proven.
The model was also not confident about any one post. Its probabilities for each of the 10 levels stayed between 0.09 and 0.11. It ranks a creator's posts a little, but it cannot tell you that one post will do well.
Post age predicts as much as the model
There is a simpler signal than anything in the video: how long the post had been up. Inside each creator, post age alone gave a correlation of 0.13 on all 20,737 posts in the dataset, and 0.15 on the test posts. Older posts had longer to collect views.
No videoVideo
- Post age alone
- 0.2
- Coeus trained on views
- 0.1
- Coeus untrained hook strength
- 0.1
Within-creator Spearman correlation with the views percentile. Model rows use the 1,431 test posts both models scored; post age uses all test posts.
The model never saw the post's age, and its signal is separate from it. Its correlation with age was -0.06, and against a target with age taken out it still scored 0.13. But it means a large part of what decides views is noise to any model that only watches the video: timing, the audience that day, and what else was on the feed.
What this means if you make TikToks
- A strong hook is worth having, but it is a small edge, not a switch.
- Do not make your post look like an ad. Of everything we measured, that cost the most.
- Posts with speech did a little better than music-led posts in this sample.
- No model we tried can tell you that one post will beat your others. It can only nudge the odds over many posts.
This is why we judge our own films by their numbers after posting, not by a score before. Theia, our AI content studio, posts a film, reads its views 6 hours later, and changes one thing in her own code for the next one. The weekly results are in What Theia learned.
What we did not test
- Post age in the input. It might take out much of the noise.
- Data size. We did not try a run on half the data, so we do not know if more posts would help.
- A pairwise target. "Which of these two posts got more views?" may be easier to learn than a level from 1 to 10.
- More seeds. Every number here is from one training run.
We stopped here on cost.
See every number: the results table, the weak spots and the quick start are on Hugging Face. The training code and the full paper are on GitHub.
More on Coeus:
Next entry
How the TikTok algorithm hands out views, hour by hour: 38 AI films measured
How the TikTok algorithm delivers views over time, measured every 20 minutes on 38 AI-made films across two accounts. On one account, 97% of 48-hour views arrived within 6 hours. On the other, the best films got most of their views 11 to 15 hours after posting.
Read it